
GA4 Reports
Part 6 of many about GA4 and what is coming after UA
We will pick up this installment of the Analytics after UA here at the end of this article GA4 Audiences by focusing on How to customize GA4 reports.
Basics of GA4 Reports
Standard GA4 reports provide us with a wealth of information about our users’ activity and the overall trajectory of our tracking efforts. If you’ve previously used Universal Analytics and are switching to GA4, you’ll note how adaptable the reporting interface is. Aside from the ability to produce new reports, you may also edit existing reports in any way – a feat previously unattainable in UA.
To do so, you must first understand where to look and how to activate some of these reports. It may appear complex, but we’re here to show you how to locate what you’re looking for. We’ll also demonstrate creating a new report based on the landing pages.
This guide shows you how to customize your Google Analytics 4 reports.
Please remember that we are utilizing our test property rather than Google’s demo account because modifying functionality is unavailable there.
If you’re also testing on the demo account, you must switch to a property you own. Even a brand-new, empty one should work, though you will notice how your changes affect the data afterward.
Standard GA4 Reports and How to modify them
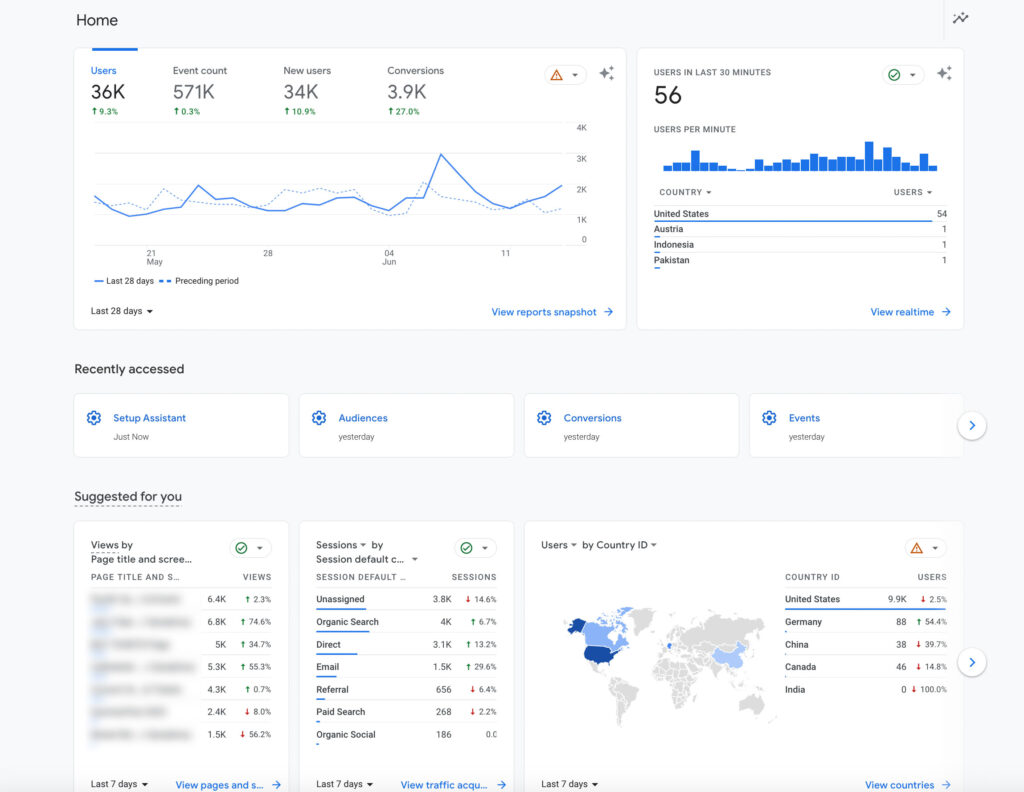
Let’s start by looking at what a standard report looks like.
In your Google Analytics account, go to the Traffic acquisition report.
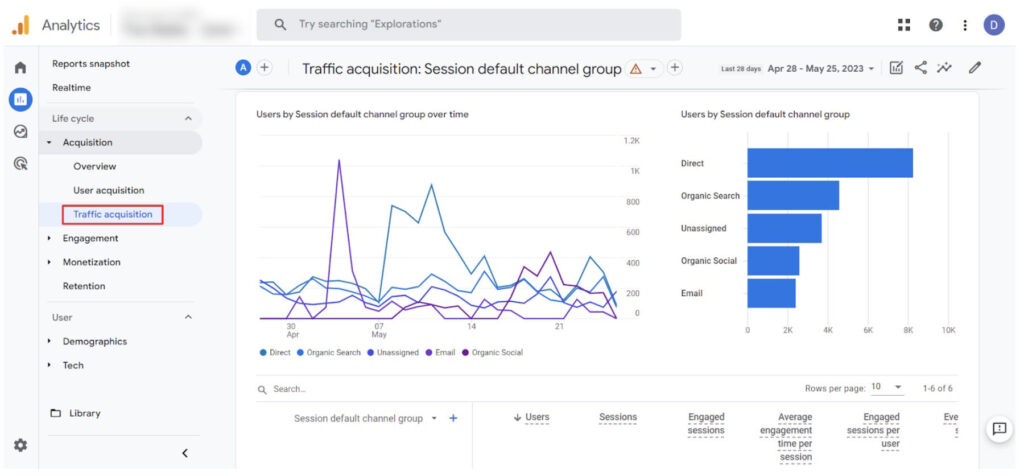
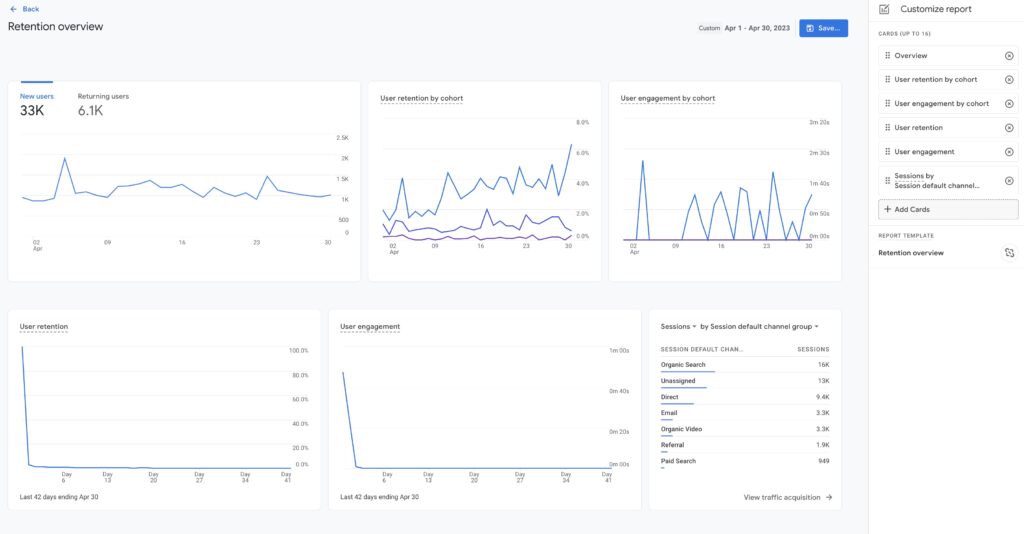
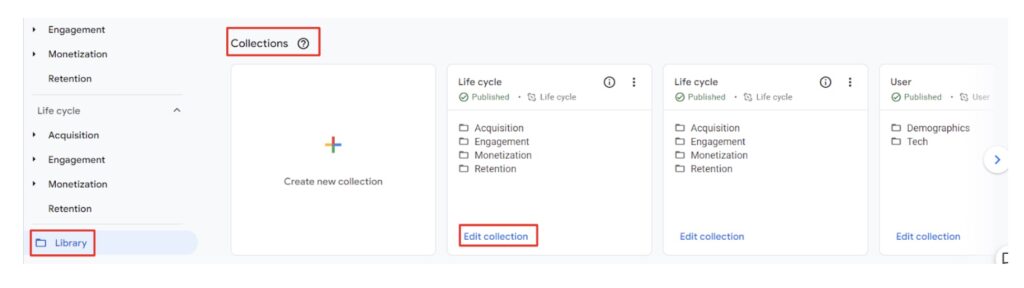
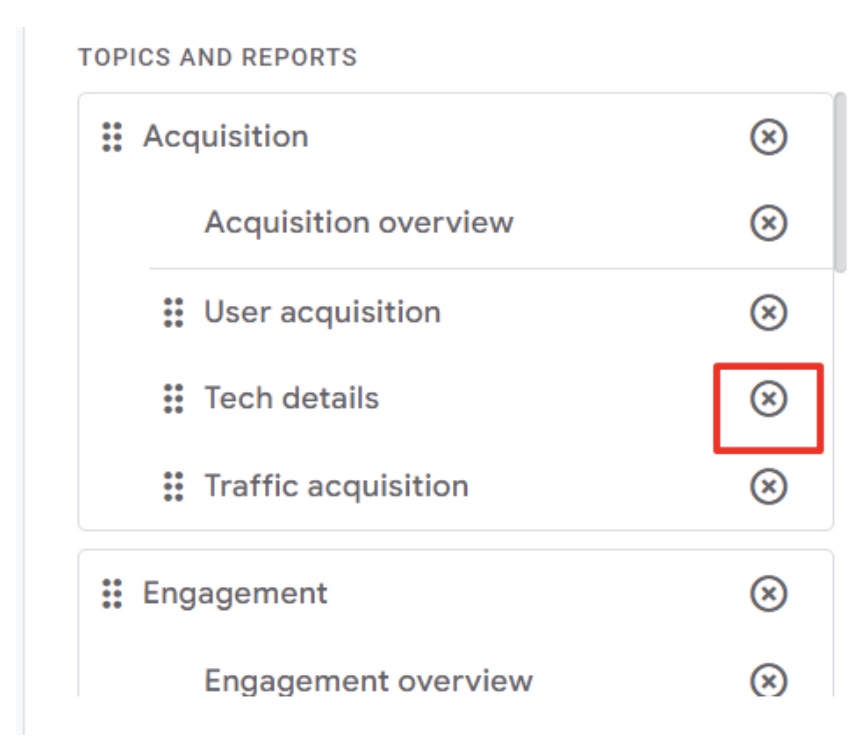
Standard reports are available for alteration, reorganization, and interface changes to suit your preferences. Going back to the Library and editing the collection the report is in will allow us to remove an entire report topic quickly.
Let’s use the retention subject as an example, as we don’t utilize it frequently and think it’s optional.
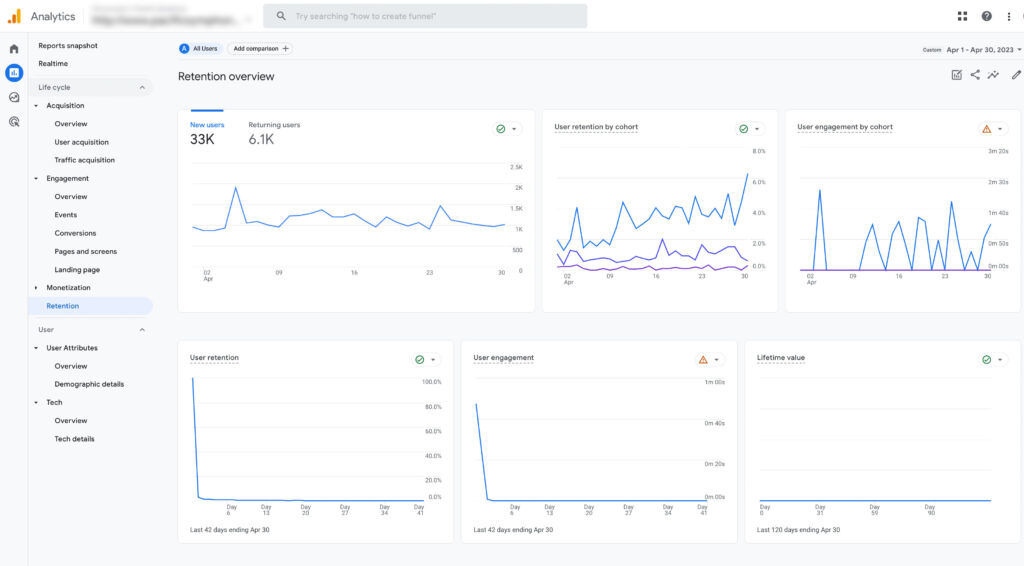
Go to Library → Edit collection under the life cycle collection, and follow the example below. Remove the panels you don’t want, add additional panels, and save.
Customize your GA4 Report Layout
To start customizing your Google Analytics 4 reports, determine what changes you want to make. For this example, let’s try removing the visualization charts.
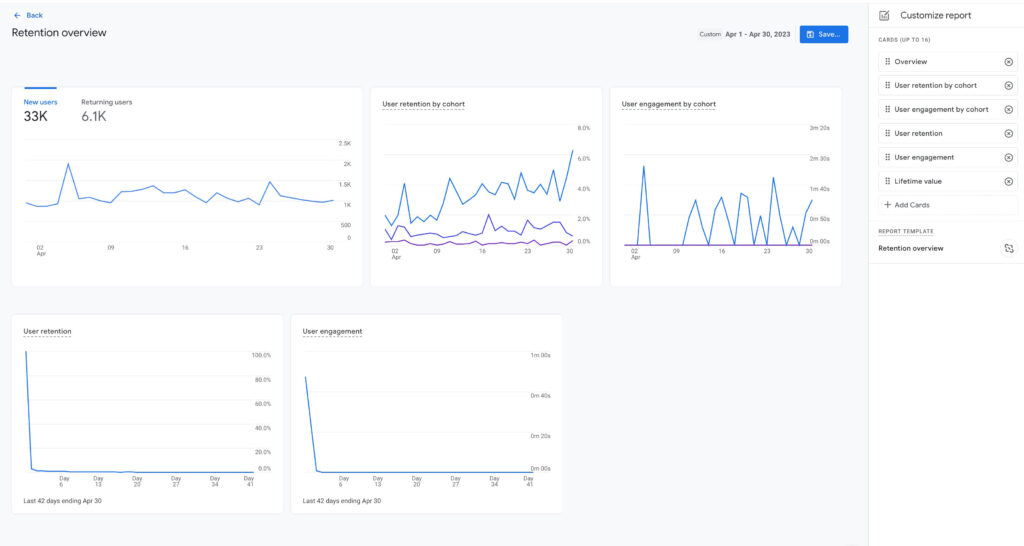
At the top-right corner, click on the customize report icon.
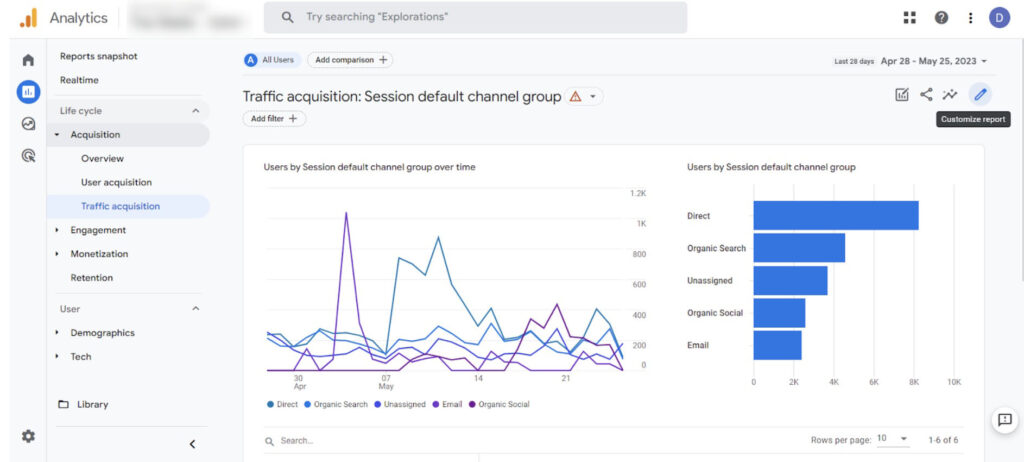
The panel at the right shows the different aspects of the report you can change.
To hide a chart, click on the eye icon beside the said chart. A backslash symbol will cross through the eye icon to signify that it is hidden.
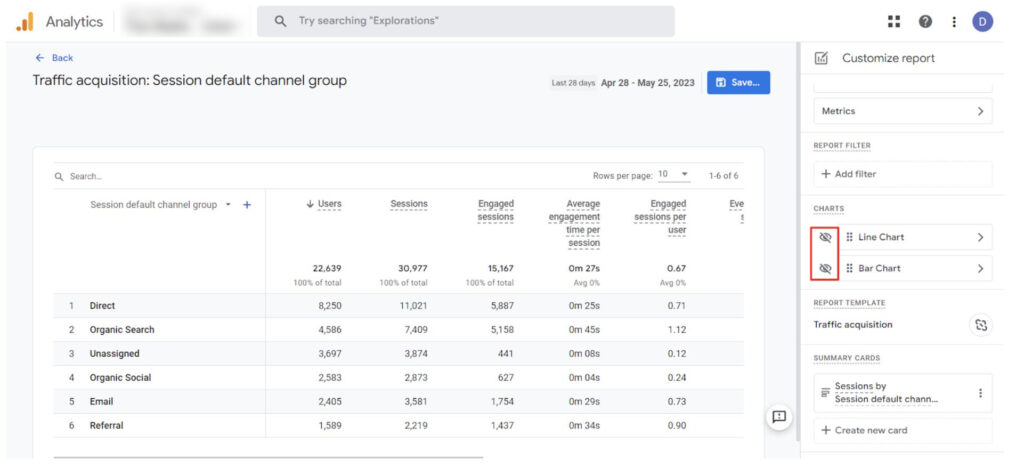
You should see that the charts are no longer part of the report, and only the table will remain. Next, let’s look at and modify the metrics shown in this report by clicking on Metrics.
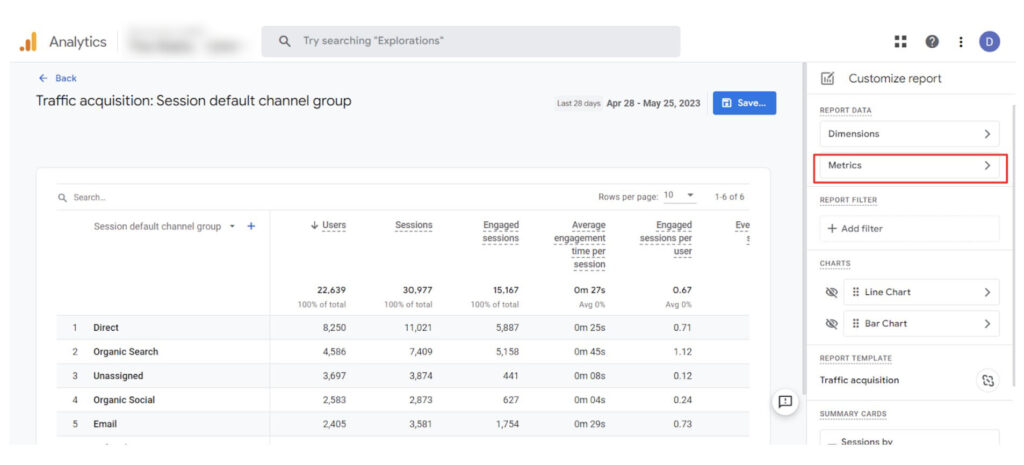
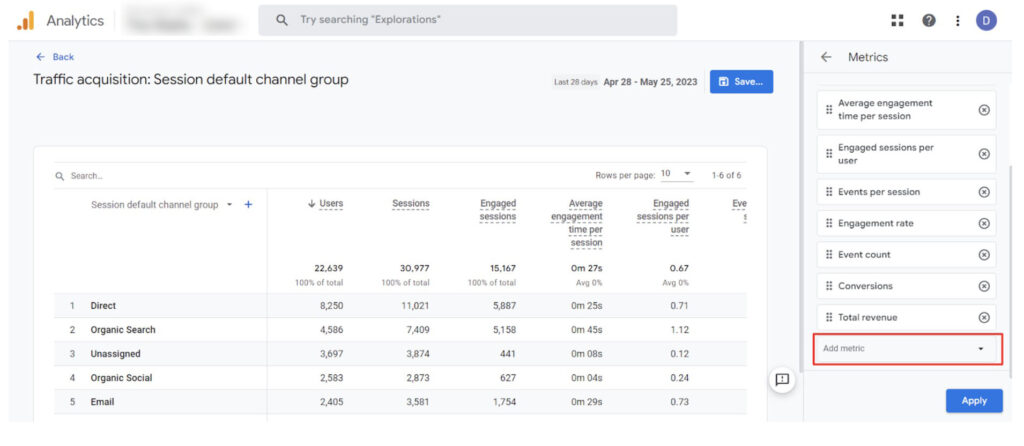
The panel will present the visible list of metrics. If you want to remove a metric from the report, click the ✖ button to the right of the metric name.
In the list of metrics, we have the event count, engagement rate, conversions, etc., but what about the conversion rate? It is available in GA4, so this metric is present, but we must add it manually.
Adding Dimensions & Metrics to GA4 Report
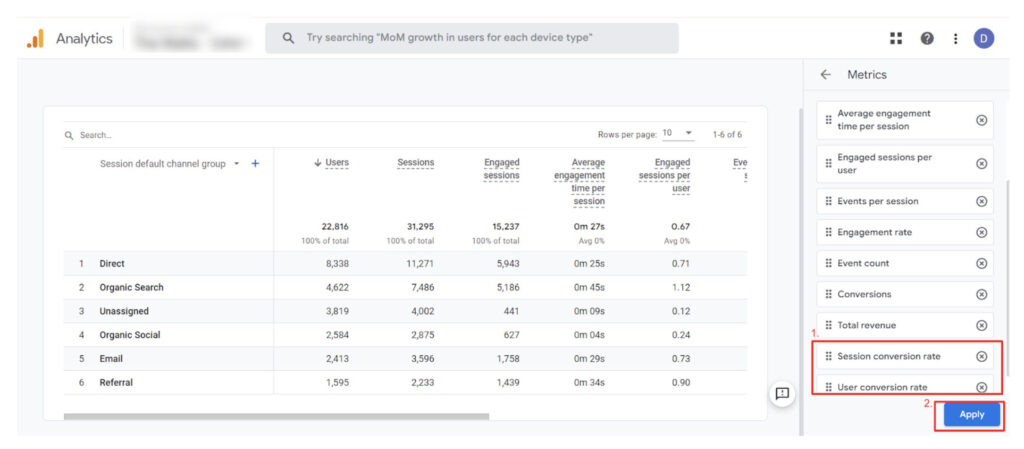
Click Add metric at the bottom if you want to add a metric.
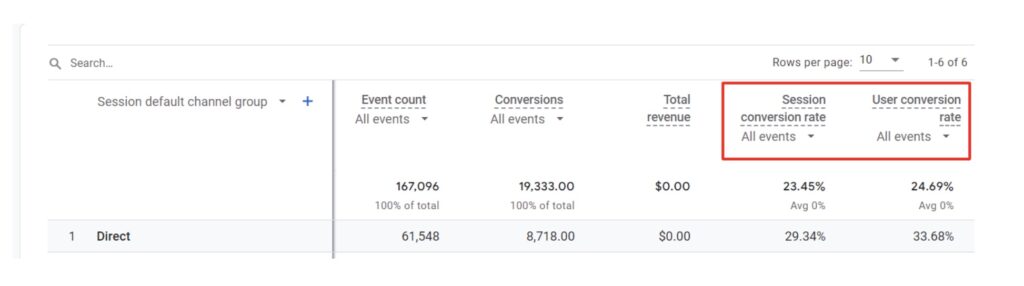
Browsing through the list of metrics, you’ll notice two conversion rates available in GA4: session conversion rate and user conversion rate.
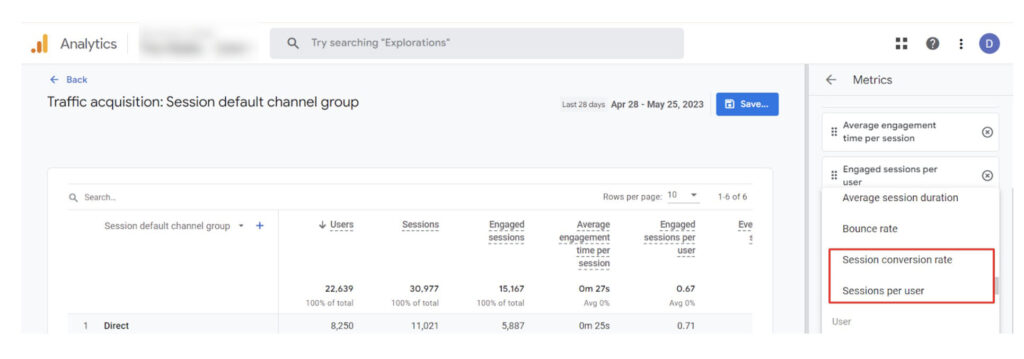
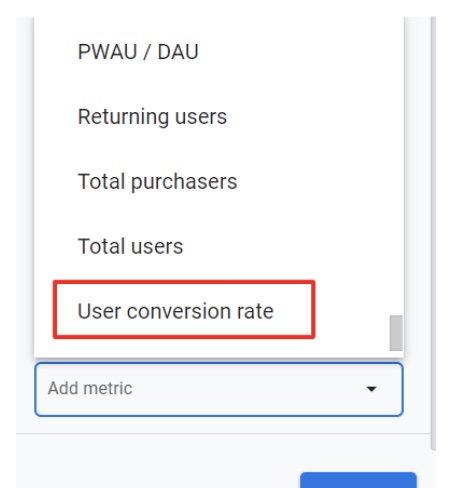
Add both metrics to the report.
You could be unsure of how the two differ from one another. The user conversion rate displays the proportion of people who converted. The session conversion rate, on the other hand, indicates the proportion of sessions that resulted in conversions.
Organizing Your Report
Let’s change the placement of our metrics.
You can decide how you want the metrics displayed, but placing the conversion rates right after the sessions is preferable.
Upon satisfactory placement of the metrics, click on Apply.
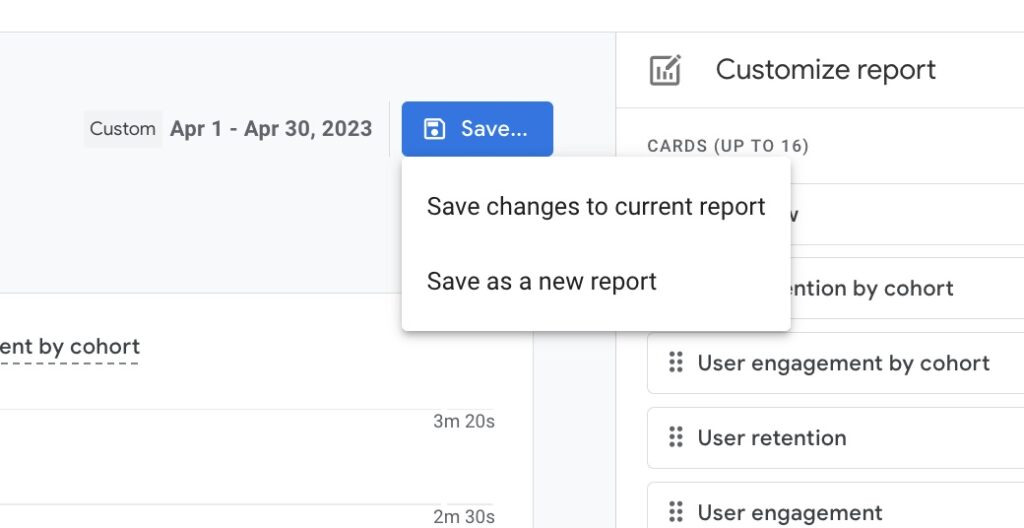
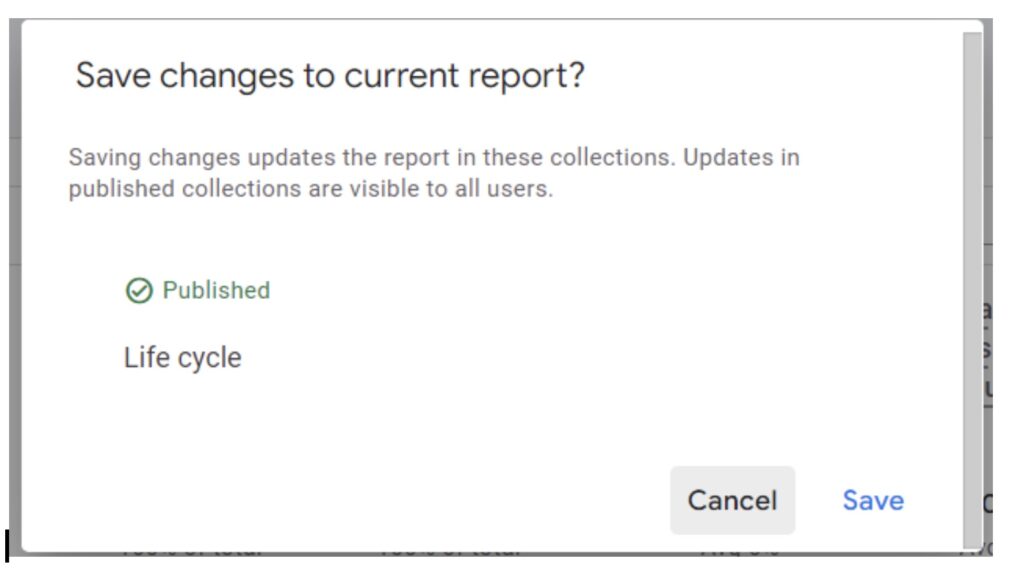
To save the changes we’ve made, click Save → Save changes to the current report.
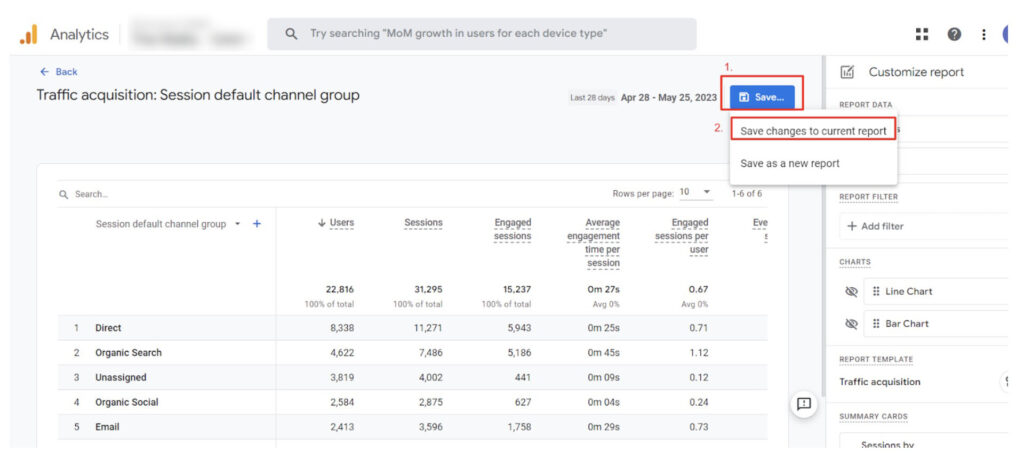
A popup will appear. Click Save one more time.
Besides the sessions column, we should only see the detailed table and the session and user conversion rates.
Creating Your Report in GA4 (GA4 Landing Page Report)
Making your own Google Analytics 4 reports is another method to personalize them.
Consider the scenario where we would like to involve a team of marketers in our project. However, they want to avoid fiddling with the reports’ configuration or going through multiple reports to find the necessary data.
They desire a single report with all the required data, in this case, the landing page report. You search your account but are unable to locate it. Therefore, you conclude that GA4 does not have it.
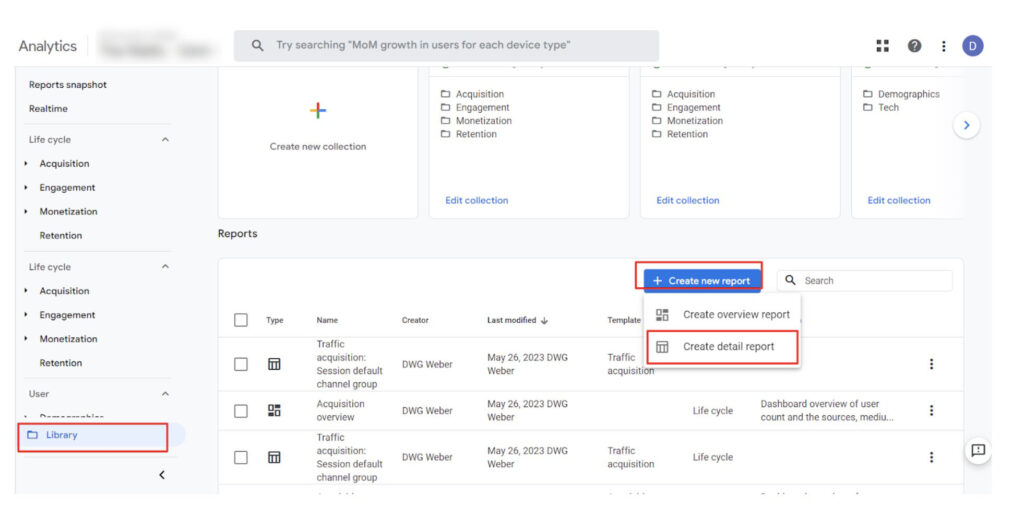
Go to Library → Create new report → Create detail report.
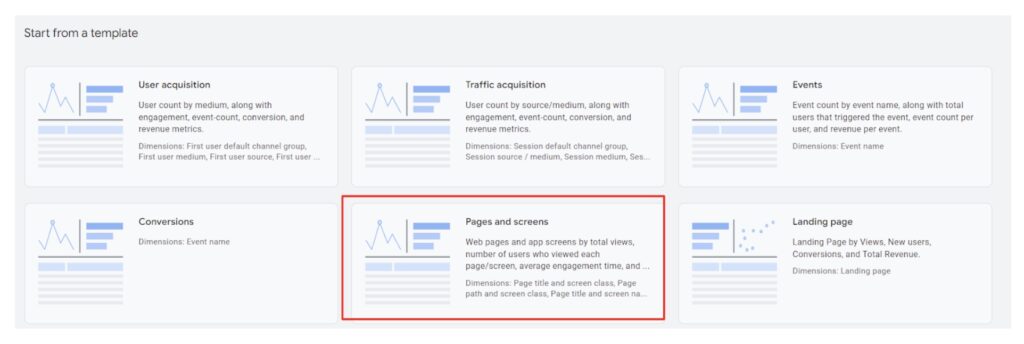
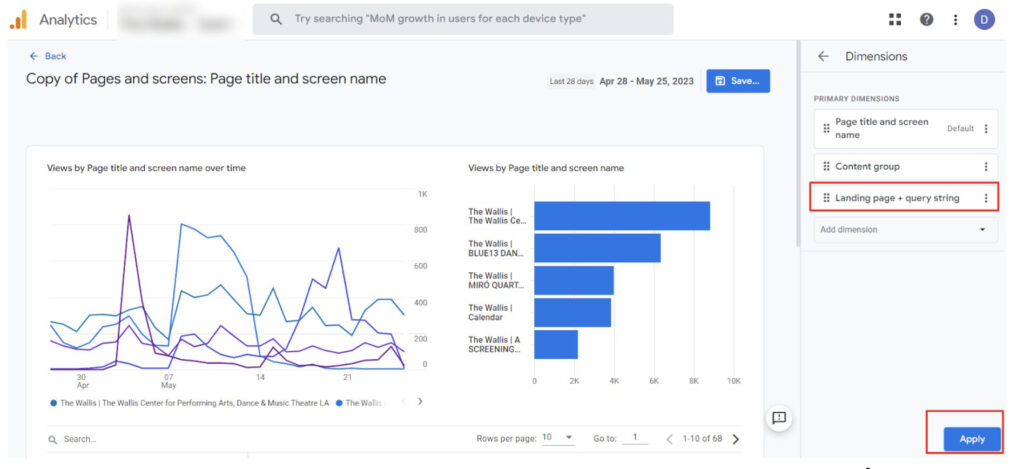
To make our lives easier, let’s start with a template. Select the Pages and Screens template.
You’ll see that we already have a typical report layout. We only need to modify the information that is displayed here.
Click on Dimensions.
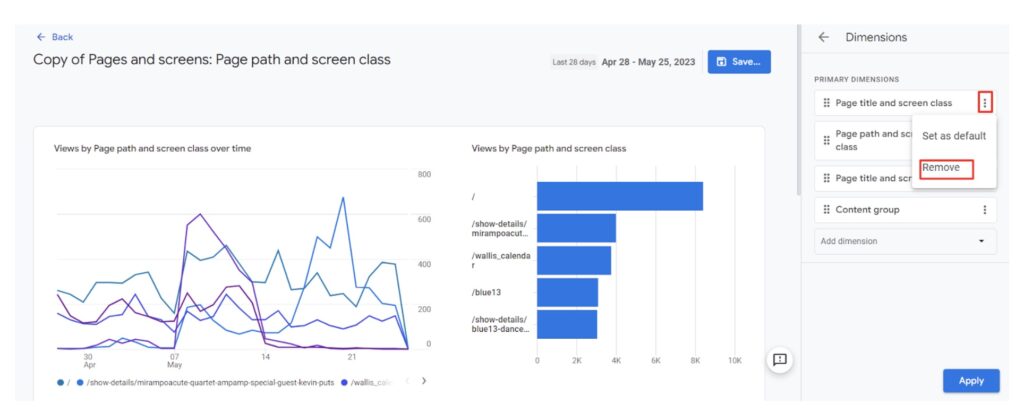
Click on Add Dimension.
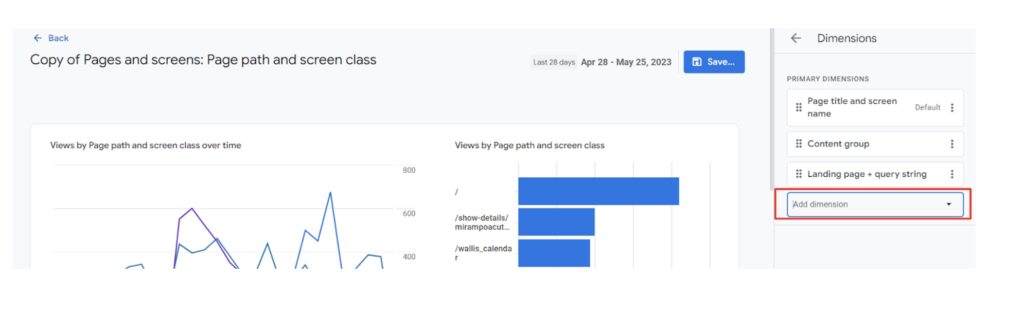
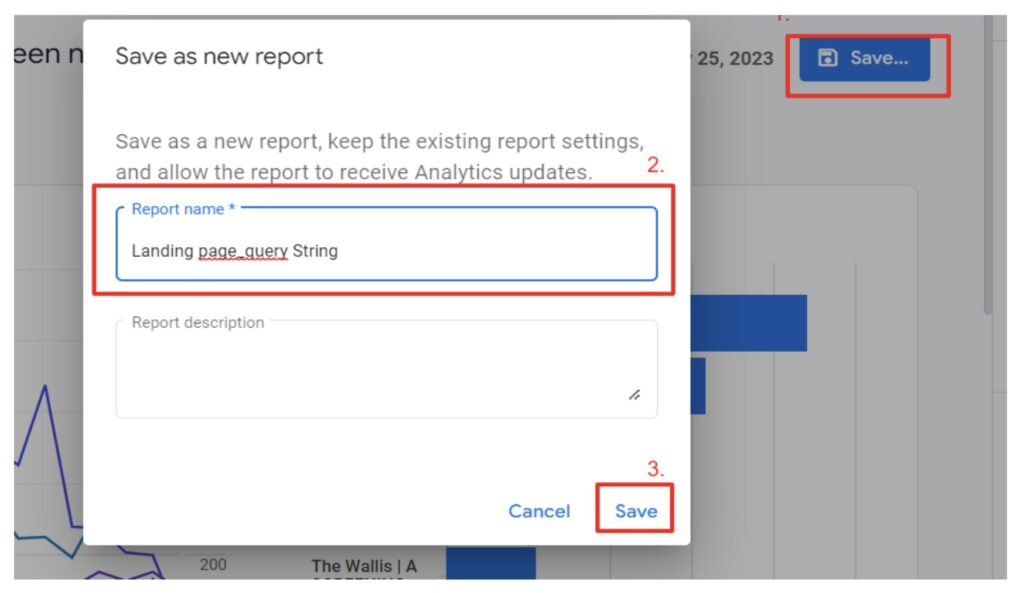
Add Landing page + String as a Dimension parameter and click on Apply.
Provide a name for the report and an optional report description. Then, click Save.

Returning to the reports library, you won’t find the landing page report in any report collections yet. It is not enough to create a report; we need to add the new report to a collection.
Adding a Report to a Collection
In our case, let’s add the landing page report to the life cycle collection.
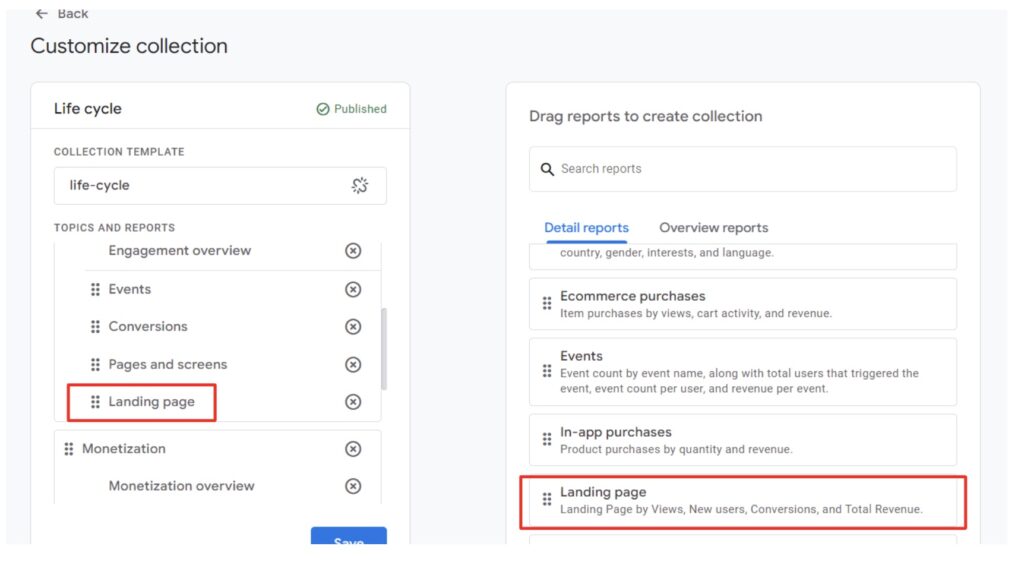
Click on Edit collection under the life cycle card.
Editing will open a window with the life cycle collection structure on the left and a list of reports we may include in the collection on the riEditingght.
Drag the Landing Pages report under the engagement subject after finding it in the detail report bar.
If you want to remove a specific report from the collection, click the ✖ button next to the report name.
When you’ve made all the required changes, click Save → Save changes to the current collection.
Hope this series on how to manage GA4 has proven helpful. We will try to provide more hints in the future.
Dream Warrior Group, a Los Angeles Based web design and digital marketing Company, providing solutions for your online marketing needs. Our expertise includes Search Engine Optimization (SEO), Social Media Posts & Marketing & Google PPC campaigns. Call us now at 818.610.3316 or click here.


